
Data Analytics & Dashboard Development in Zimbabwe
Your data already holds the answers. We bring it together from your systems and spreadsheets into live dashboards and reports that managers, boards and donors can trust.
From scattered data to decisions
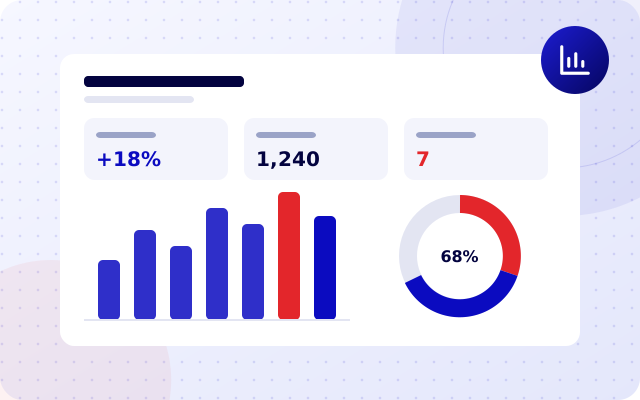
We connect your data sources, clean and structure the data, then build dashboards around the decisions you actually make: sales, stock, programme indicators, finance or operations.
Reports update automatically, so your team stops compiling spreadsheets every month and spends that time acting on what the numbers show.
What we deliver
What changes for your organisation
Where this makes a difference
Discuss your requirements with JomeTech
The proposed approach, scope and expected benefits are agreed during project discovery.
Read the case study →Start with the decisions, then the data
- 01 Define Decisions, audiences and key metrics.
- 02 Connect Access and combine data sources.
- 03 Model Clean, structure and validate the data.
- 04 Visualise Build and refine dashboards with users.
- 05 Automate Scheduled refreshes, reports and support.
Technology we use
Security & quality safeguards
- Role-based access to sensitive figures
- Read-only connections to source systems
- Data validation and reconciliation checks
- Personal data anonymised where possible
Data Analytics & Dashboards FAQs
Our data is messy. Can you still help?
Yes. Cleaning and structuring data is a normal part of every project.
Do we need a new system first?
No. Dashboards can draw on existing systems and spreadsheets.
Who can see the dashboards?
Access is controlled by user role, so people only see what they should.
Can dashboards update automatically?
Yes. Data refreshes on a schedule or in real time, depending on the source.
Good to know before we start
Can dashboards use the data we already have?
Yes. We can build dashboards from spreadsheets, databases and business systems, so managers see current figures without compiling reports by hand.
How long does it take?
Typically: first live dashboard in 2–6 weeks. Exact dates are confirmed in a written scope before work starts.
How is the price worked out?
We scope your requirements first, then quote in writing. Larger work is split into fixed-price phases so you know the cost before each stage begins.
Where are you based, and how do we start?
We are in Harare and work with organisations across Zimbabwe and Africa. Send an enquiry, call or WhatsApp +263 78 377 1089 and we reply within one business day to arrange a discovery call.
Turn your data into decisions
Share your requirements and we’ll reply within one business day to arrange a discovery call.